Plot loadings with confidence bands from procrustes_loadings()
Source: R/plot_procrustes_loadings.R
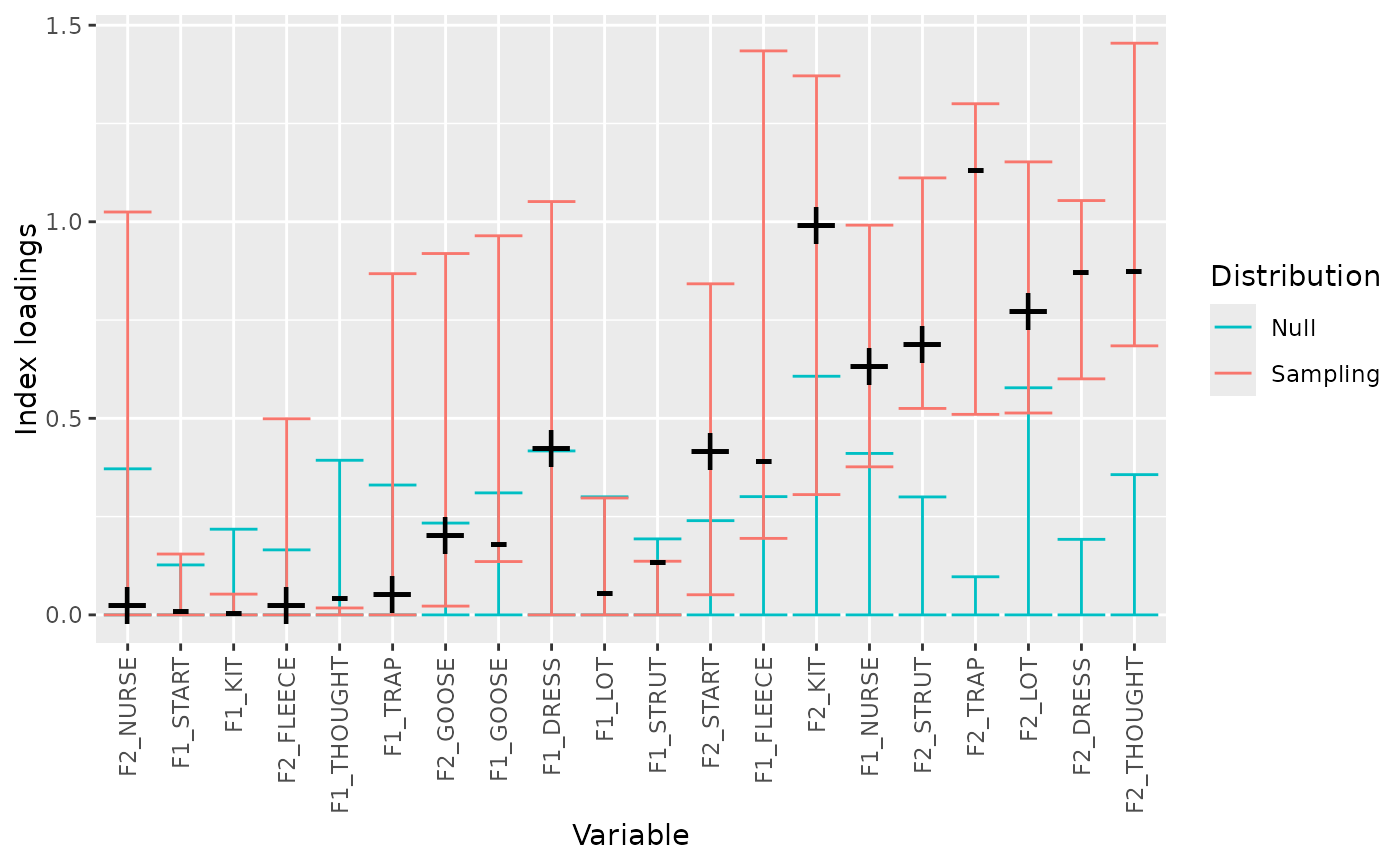
plot_procrustes_loadings.Rd![[Experimental]](figures/lifecycle-experimental.svg) Plot index loadings or loadings with
confidence intervals and null distributions generated by bootstrapping and
permutation followed by Procrustes rotation. This approach works when
PC loadings are unstable due to multiple PCs explaining similar amounts of
variance. This is an alternative to the use of bootstrapping without
Procrustes rotation (as in
Plot index loadings or loadings with
confidence intervals and null distributions generated by bootstrapping and
permutation followed by Procrustes rotation. This approach works when
PC loadings are unstable due to multiple PCs explaining similar amounts of
variance. This is an alternative to the use of bootstrapping without
Procrustes rotation (as in pca_test()) and avoids the need for the use
of the filter_boots argument to plot_loadings().
Arguments
- proc_loadings
a tibble, generated by
procrustes_loadings()- pc_no
an integer indicating which PC to plot.
- loadings_confint
confidence limits for generated confidence intervals. (default: 0.9 to match
pca_test()).
Examples
  proc_loadings <- procrustes_loadings(
    pca_data = onze_intercepts |> dplyr::select(-speaker),
    max_pcs = 3,
    index = TRUE,
    n = 10, # set this to at least 100 in actual use.
    scale = TRUE
   )

   plot_procrustes_loadings(proc_loadings, pc_no = 2)